
As the SARS-nCoV-2 pandemic has matured globally, and more results of antibody testing come in, the aperture has closed in on a narrower spectrum-answer to how deadly the virus actually is.
On 4/19, my first post on this topic explained why I felt that antibody studies were being overblown, by leading many to claim SARS-nCoV-2 was not much different than a typical, strong influenza strain. This time, I went deeper into the data to try and and narrow my guess; even though the economy has taken center stage, 2020 will still be framed by the CFR number of this pandemic virus. The current CFR of confirmed cases is 5.84% in the US and 7.02% worldwide, but the unknown variable is the actual number of infected persons. As my chart below shows, the ultimate difference in final deaths could be anywhere from 100,000 to 570,000 – with the latter figure a result of the same total # of infections as H1N1 in 2009:
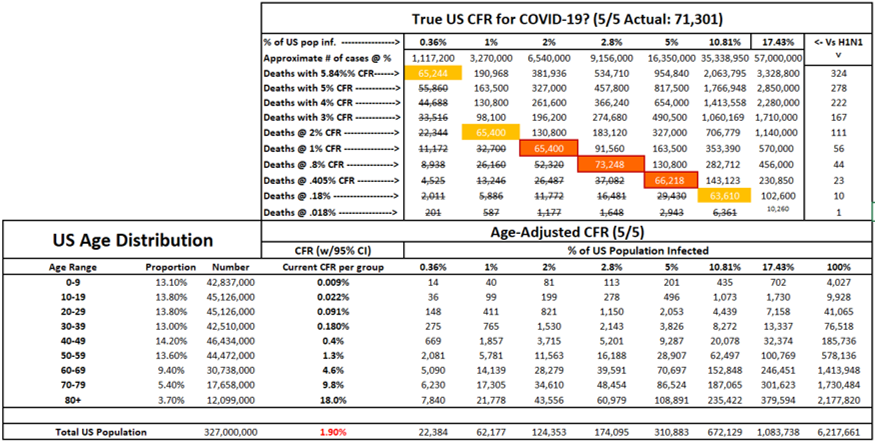
What does this chart mean? The orange highlights are my guesstimate, based on total deaths instead of rate of infection. I chose deaths over infection % because only one of those metrics represents factual data; I should note that the death statistic is a minimum that doesn’t show unconfirmed cases, so that number is also lower than reality. The yellow represents a maximum range.
Previously, I tossed out the comparison with H1N1 as statistically ridiculous, and this time I chose to cross-reference my prediction with another critical variable – age, because children under ten have a .009% chance of a fatal infection, and adults above 80 have an 18% chance. This 2,000-fold difference is what can really show us the impact of the pandemic, as the bottom half of the table illuminates.
When age is factored in with CFR rates, it produces a roughly 1.1% figure for total infections; 3.72 million, or 3 times the current confirmed total. It also correlates very well with the expected deaths per group, but an exact measurement is difficult because the CDC age groups are not the same as the WHO (i.e. 15-24 vs. 10-19).
Unless the Oxford, CDC and China numbers are way off base, the true CFR is closer to 40 times greater than H1N1 than 2-3. That equates to 1,083,738 deaths if the total % of infection matches 2009’s Swine flu pandemic; 94.86% of those deaths being 50+.
As the pandemic continues to run its course, I would be wary of any projection that uses one number we don’t know (total infection rate) to forecast a different unknown number.
But then again, I wrote a thesis about Roman bureaucracy.
— Rixey