Mixed Signals obscure the Actual danger in the “Middle”*

COVID-19 & politics is a touchy topic, but my analysis is bi-partisan – our corridors of power are infected by opportunistic vampires. How bad is COVID? As bad as it needs to be to win an election, of course.
*I feel inspired to throw in a remake of a familiar quote, which came to my fevered brain while reading the news in March (still relevant):
“You can lead a horse to water, but you cannot make him drink;
You can lead a fool to insight, but you cannot make him think.”
In April, I posted a table to illustrate expected total deaths from COVID-19, by examining a variety of possible CFR’s (Case Fatality Rates) and providing totals for each rate based upon the % of the US population infected. It has been widely understood that, if most people who contract COVID-19 never show symptoms, then the very high CFR’s from confirmed cases represent artificially inflated snapshots. The unpublicized footnote is that politicians
The frustrating reality is that humanity’s usual method for calculating such figures has been to study the evidence once an epidemic has run its course. In March, there didn’t appear to be much optimism or expectation in this effort, reminiscent of how resigned experts looked when explaining the length of time needed to produce vaccines – as if literally nothing could be done to streamline a ‘rather’ bureaucratic process.
I doubt most people are going to refrain from all of the potential candidate vaccines until June 2021, just as I imagine the FDA will magically overcome some of their typical objections to emerging medications. I fully support their courage in graciously choosing not to stand in the way just this once – because my opinion “this isn’t really the flu” hasn’t changed over the last 3 months. It’s a shame the rest of the political class can’t decide whether it’s a decent flu or some mixture of bubonic plague+ebola+anthrax; the concept of “the middle” is anathema these days, but just as with any other variety of vampire, I imagine there comes a point at which circumstances make their fear of a vegetable easier to digest.
Or maybe garlic is just that terrible, since 125,000 deaths have yet to spur consensus on the diagnosis. Thankfully, as my wife can attest, I am not encumbered by the presence of vegetables – but while Atlas refused to shrug I decided to go research the CDC’s influenza records. I didn’t have to be a scientist to spot the difference between the flu and COVID; I just counted. In the last 15 years, the average number of flu deaths has been rising because the more dangerous strains have been circulating more often than not, whereas the 3 previous decades experienced lower CFR’s and thousands of fewer deaths. The re-emergence of H1N1 in 2009 was terrifying for many experts, since death tolls for the “usual suspects” had been reaching record levels since the late 1990’s, but a year later 10,500 had died (est.), out of 57 million infections in the US.
The dire projections stemmed from the fact that the first global emergence of the H1N1 strain was in 1918; the novel influenza devastated a world without antibodies, producing 675,000 deaths in the US and 17-50 million worldwide (1-3% of infections).
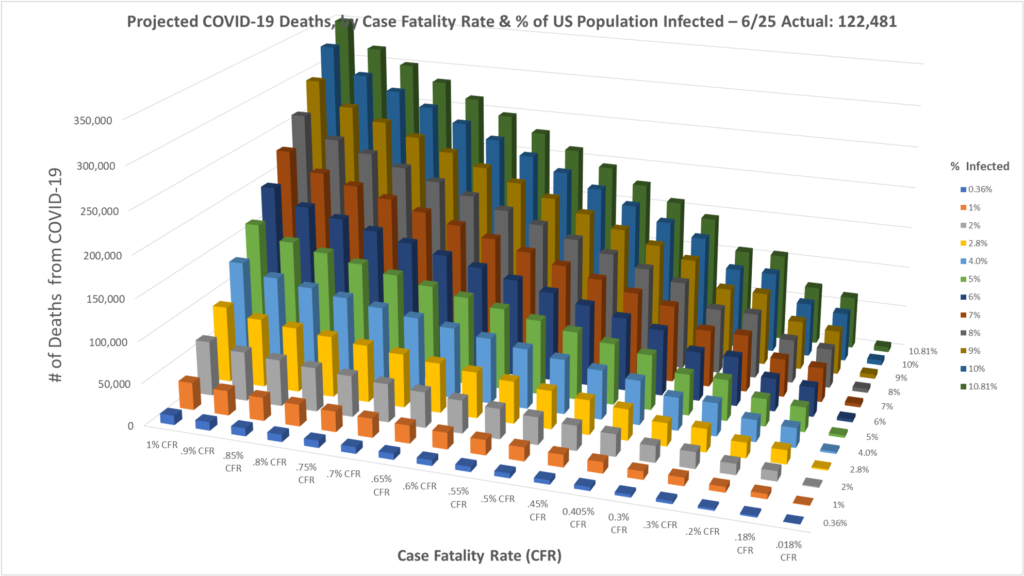
Whether your ideal “safe space” is a gun range or a campus lounge, if you weren’t born before man landed on the moon (FYI: 1969), then statistically COVID-19 is like the flu. But 100% of you have parents, family members, etc. that are vulnerable; an average-sized Thanksgiving for my family (15-20) would produce 2 deaths with 100% infection. The attached 3-D graph portrays the data from my latest iteration of CFR projection (another picture below). Any column lower than the halfway point of the graph means that the US CFR and/or infection rate are higher or lower than that mark, respectively. I can make that claim because the 3rd variable is total deaths – it’s the only known variable and the absolute minimum, since CDC research continues to show far more deaths than expected in the overall mortality statistics from all causes, after accounting for confirmed cases.
For the CFR to be the same as H1N1 (.018%), the total infection number would have to reach 700 million; America is the greatest country on Earth, but even our 110% effort would be 350 million people short. The .2% typical flu CFR would only require 70 million infections, but H1N1 (highly infectious) took a year to reach 57 million – with no global lockdown, social distancing or people outside of hospitals wearing a mask.
The graph indicates that the likely answer falls somewhere in the middle, .5%-.9%, leaving us on pace for “only” 300-350K deaths before flu season. If a vaccine doesn’t fully arrive by February, only random mutations or absolute quarantine would prevent this pandemic from eclipsing the Civil War and Spanish Flu as the deadliest event in the history of the United States. Congress could just pass a law requiring all businesses to allow employees 50+ to work from home and subsidize both sides for a year, to nullify most of the negative impact.
How depressing it is, to know that our situation has not yet become scarier than a vegetable to the vampires. I can’t confirm that our current Congress is composed of soulless, blood-sucking leeches who feed off of innocent victims under the cover of darkness, but it’s clear that they managed to spend trillions of dollars in stimulus with little pause for reflection. And, now that I think about it, there’s a more obvious and understandable explanation: If I were a member of Congress, or almost any elected leader, the last thing I’d want to see is whatever was staring back at me in a mirror.
C.H. Rixey
