Very soon, we will be faced with whatever punishment is coming after the implementation of a global lockdown. There have been so many effects on our daily lives and income that we truly have no past example to reflect upon.
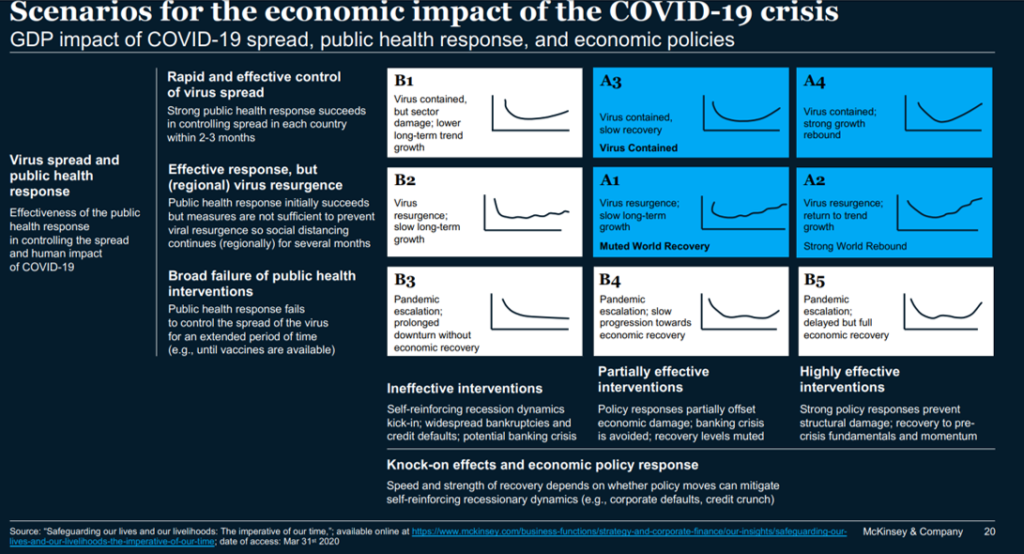
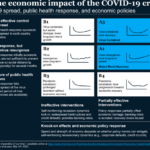
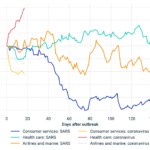
This chart shows 9 possible trajectories for our US GDP through the year, based on how effective our response to the pandemic is. These models allow companies to consider various options so that a semblance of planning can return, but McKinsey’s (a globally respected consulting firm) model fails to address the possibility of a full return of the virus this winter.
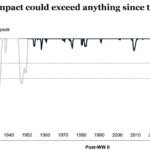
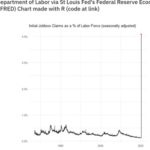
It’s hard for me to be too disappointed about such models, however, when everyone is trying to make sense of images like this:
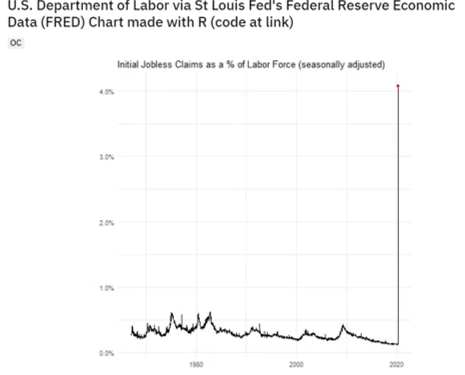
It’s hard to truly encapsulate how unique this event is in modern history; but in the last four weeks the record for new unemployment claims was broken by 700% at first, and then that record was broken again. (4 & 6 million in two weeks, followed by 6.6 last week). In a month, we went from record-low unemployment to the worst level in 85 years, topped only by the depression: 3% to 13%.
Tomorrow, i will explore specific aspects of the economy, followed by an inspection of social distancing and its efficacy against the spread of COVID-19.
C.H. Rixey

